%matplotlib inline
# these two lines are only necessary to make the jupyter notebooks run on binder
import sys
sys.path.insert(0, "../..")
# We load the FHIVibesPhonons class from aimstools
from aimstools.phonons import FHIVibesPhonons as FVP
import matplotlib.pyplot as plt
# We initialize this class from results in the directory "bandstructure"
phon = FVP("phonons")
# We set up a figure
import matplotlib.pyplot as plt
from matplotlib import gridspec
fig = plt.figure(constrained_layout=True, figsize=(8, 6))
spec = gridspec.GridSpec(ncols=2, nrows=1, figure=fig, width_ratios=[3, 1])
ax1 = fig.add_subplot(spec[0])
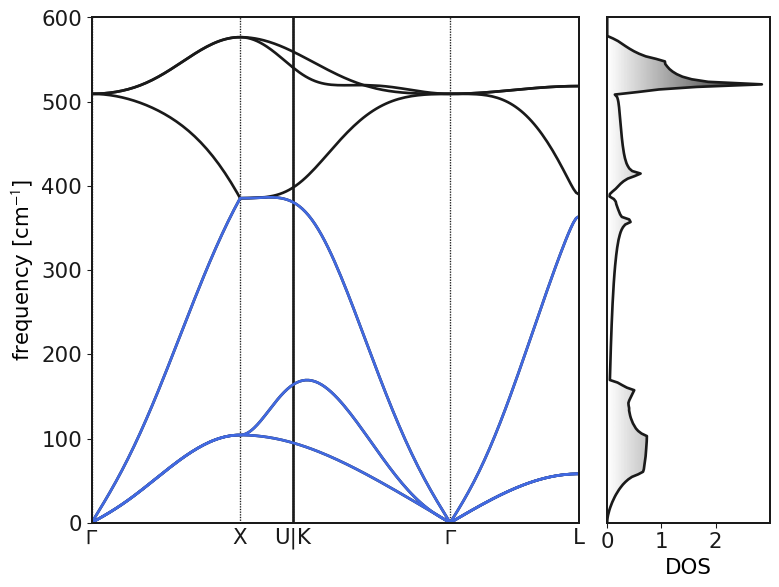
ax1 = phon.plot(axes=ax1, show_acoustic_bands=True, unit=r"cm$^{-1}$")
ax1.set_ylim([0, 600])
ax2 = fig.add_subplot(spec[1])
ax2 = phon.plot_dos(axes=ax2)
ax2.set_ylabel("")
ax2.set_yticks([])
ax2.set_ylim([0, 600])
# Here are some tools to analyze the modes
gf = phon.get_gamma_point_frequencies()
sg, reps = phon.get_irreducible_representations()
print("Space group: ", sg)
for indices, label in reps:
freqs = ["{:.3f}".format(gf[i]) for i in indices]
freqs = ", ".join(freqs)
print(freqs, label)