Visualizing Results
The command-line utility aims_plot can be used to plot band structures, densities of states and phonons out-of-the-box with sensible defaults. For more advanced plots, it is easier to use the python interface.
The utility is a typer interface:
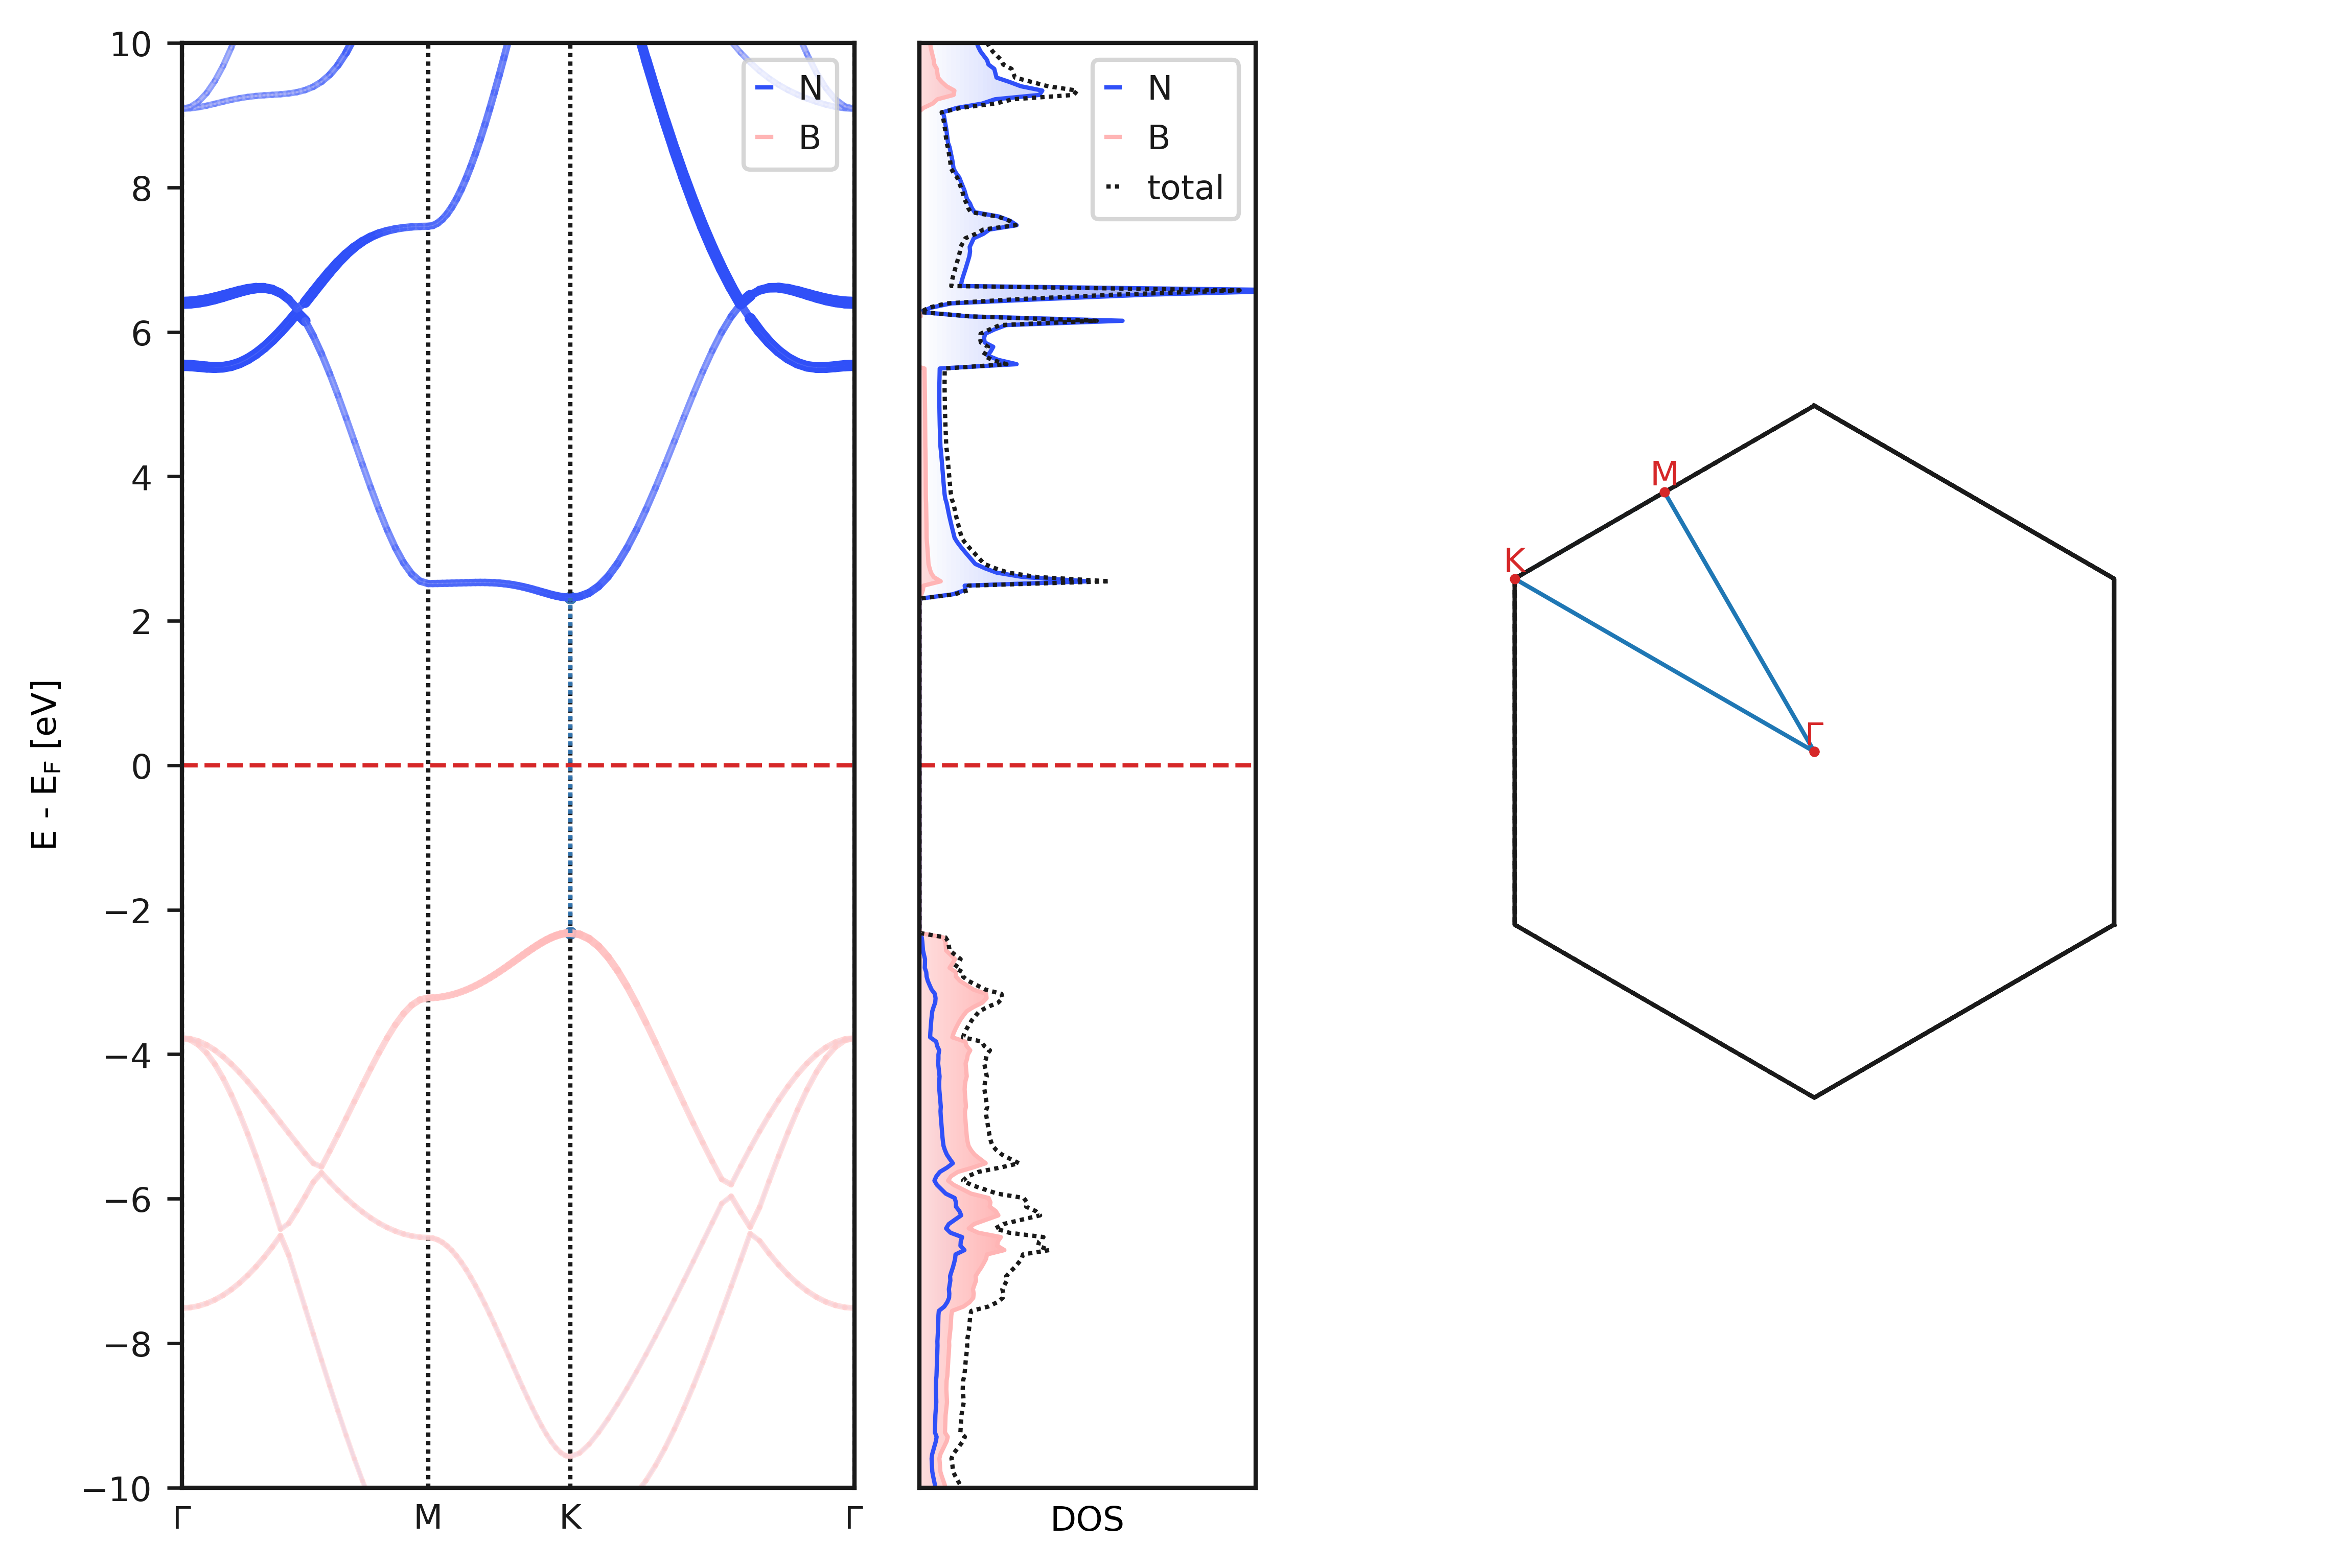
aims_plot -bs path/ -dos path/ -t paper bandpath='GMKG'
The option -t or --target can either be presentation or paper and chooses sensible defaults for font sizes, line widths etc. The latter option also saves the plot to a file named aimsplot.png.
Any keyword arguments can be specified as key-value pairs separated by an equal sign, such as reference="VBM" or bandpath="GMKG".